Construction starts October 2026 Dodge Construction Network
Construction starts rose 22.8% in October to a $1.63 trillion rate as manufacturing starts added $320 billion
Dodge says manufacturing starts increased $320 billion into October, more than the whole $303 billion rise in total starts. One project accounts for much of it, the $16.8 billion Tesla Terafab chip plant in Anderson, Texas.
- Total starts, October 2026
- $1.63 trillionSeasonally adjusted annual rate, preliminary
- From September
- +22.8%September revised: $1.33 trillion
- Excluding manufacturing
- −1.1%Eric Gaus, Dodge chief economist
- 12 months through October
- $1.451 trillionUp 13.0% from a year earlier, not seasonally adjusted
Total construction starts, billions of dollars, seasonally adjusted annual rate (SAAR). September 2026 as revised in the October release; October 2026 is preliminary. The manufacturing step is the increase Dodge reports. Source: Dodge Construction Network, October release.
Total construction starts rose 22.8% in October 2026 to a seasonally adjusted annual rate (SAAR) of $1.63 trillion, Dodge Construction Network reported in a release dated November 20. A SAAR takes one month's dollar value of projects breaking ground, removes the usual seasonal swing, and states it as a yearly pace. The gain is measured from September's $1.33 trillion.
Dodge does not publish a year-over-year change for a single month, but its 12-month total through October was $1.451 trillion, up 13.0% from the 12 months through October 2025. October's figure is preliminary. It is the third-highest rate of the 13 months shown below, behind July and May, and it sits about 18% above the 12-month average of roughly $1.39 trillion.
Total construction starts, billions of dollars, SAAR, October 2025 to October 2026. Monthly change is the figure Dodge printed in each release, also listed in the table at the end. October 2025 through August 2026 are the sums of segment rates as first reported in each month's Dodge release; September 2026 is as revised in the October release; October 2026 is preliminary. Source: Dodge Construction Network monthly releases.
The monthly-change column is the figure Dodge printed in each release, measured against the prior month as revised at that time. Dividing one row by the row above will not always reproduce it, because the rows hold first-reported values.
What moved
Nonresidential building rose 47.7% to $865 billion and carried the month
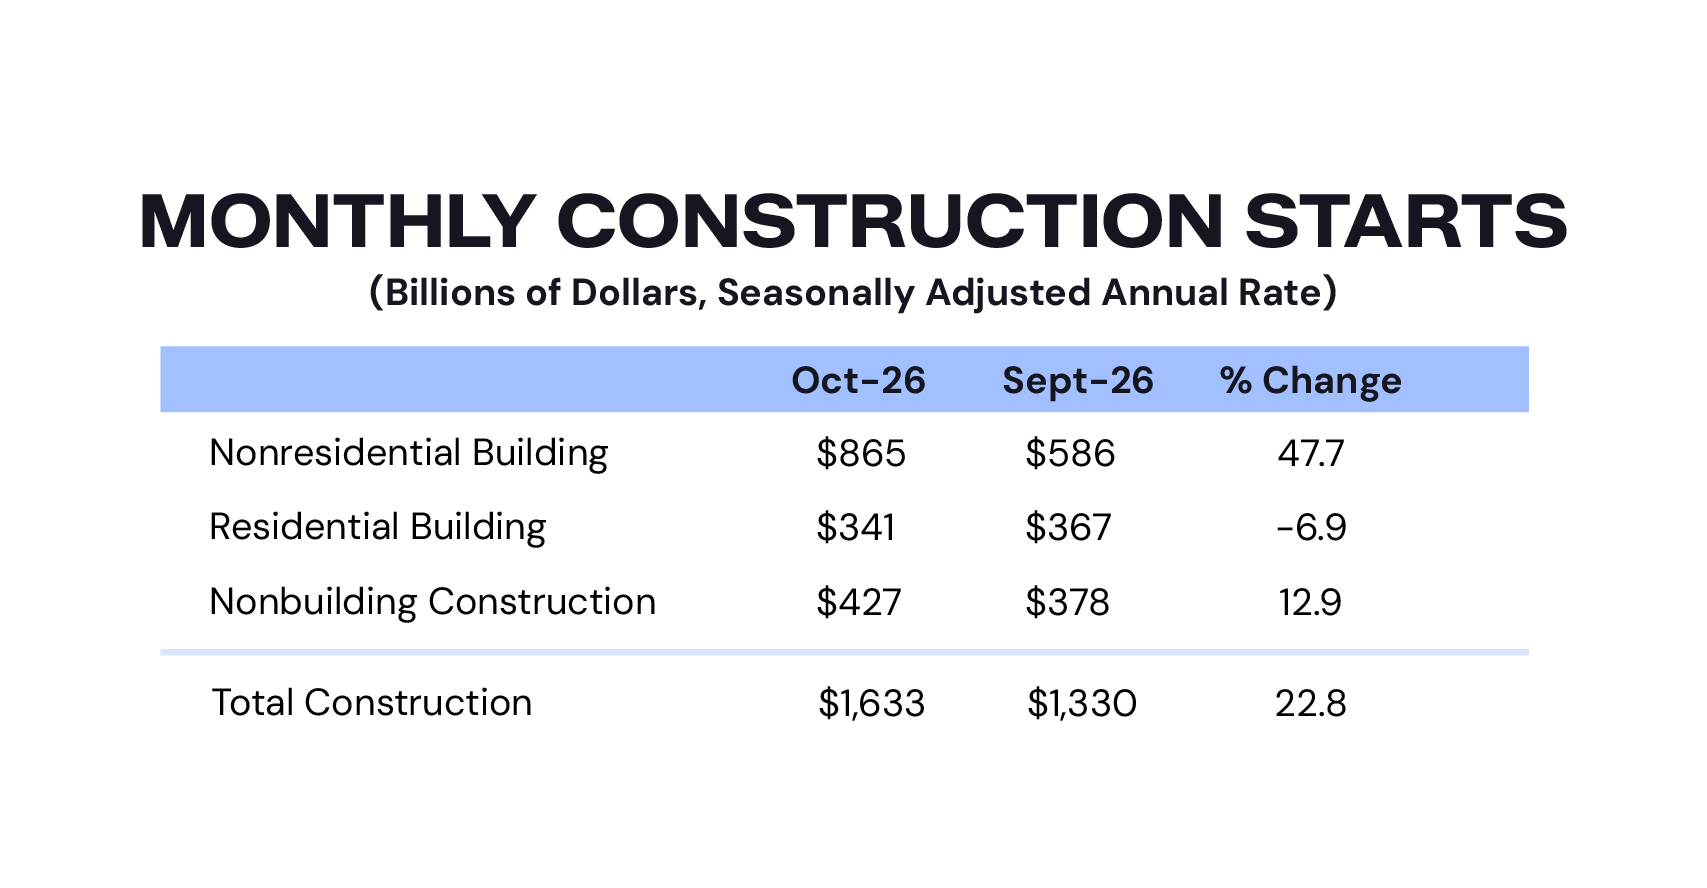
Nonresidential building starts carried the month. They rose 47.7% to an $865 billion rate, while residential building fell 6.9% to $341 billion and nonbuilding work (highways, utilities, public works) rose 12.9% to $427 billion.
Starts by segment, billions of dollars, SAAR, September 2026 (revised) to October 2026 (preliminary). Labels are Dodge's monthly change. Dodge rounds each segment, so the steps sum to within $1 billion of the total. Source: Dodge, Monthly Construction Starts table, October 2026.
Manufacturing
Manufacturing starts rose 1,364%, and the rest of the market fell 1.1%
Inside nonresidential, the change came almost entirely from manufacturing. Dodge says manufacturing starts increased $320 billion into October, a rise of 1,364% after a weak August and September. The total rose $303 billion, from $1,330 billion to $1,633 billion. So manufacturing added more than the whole increase, and everything else combined was lower than in September.
“Excluding manufacturing, total construction starts fell 1.1 percent.”
One project accounts for much of it. The $16.8 billion Tesla Terafab Semiconductor Fabrication Plant Phase 1 in Anderson, Texas, was the largest start of the month. If Dodge annualizes the usual way, multiplying a seasonally adjusted month by 12, a single $16.8 billion start adds about $200 billion to the annual rate before any seasonal factor. That is a reading of the arithmetic, and Dodge's release does not break the rate out by project.
Largest projects to break ground in October 2026, millions of dollars, as listed by Dodge. Values are project values, not annual rates. Source: Dodge Construction Network, October release.
Sectors and regions
Offices fell 7.3% for a fourth straight month while highway and bridge rose 42.1%
The rest of the building market was mixed. Commercial starts rose 89.2%, and among the commercial sectors Dodge lists, warehouses were the only other gainer at 7.3%. Offices fell 7.3%, their fourth straight monthly decline. Institutional starts fell 6.5%, with education down 4.9% and miscellaneous institutional down 35.5%, while healthcare rose 50.1%.
Highway and bridge starts rose 42.1%, led by the $3.2 billion I-10 Mobile River Bridge Replacement in Alabama, and environmental public works rose 38.2%. Utility starts fell 29.6% for the month but remain 39.3% higher over the latest 12 months than the 12 before.
| Sector | Oct. vs. Sept. | −100%0+100% | 12 mo. vs. prior |
|---|---|---|---|
| ManufacturingNonresidential building | +1,364% | +52.9% | |
| CommercialNonresidential building | +89.2% | +47.8% | |
| HealthcareNonresidential building | +50.1% | not listed | |
| WarehousesNonresidential building | +7.3% | not listed | |
| EducationNonresidential building | −4.9% | not listed | |
| InstitutionalNonresidential building | −6.5% | −0.5% | |
| OfficesNonresidential building | −7.3% | not listed | |
| Miscellaneous institutionalNonresidential building | −35.5% | not listed | |
| Highway and bridgeNonbuilding | +42.1% | +7.9% | |
| Environmental public worksNonbuilding | +38.2% | −5.5% | |
| Miscellaneous nonbuildingNonbuilding | +19.4% | −8.8% | |
| UtilitiesNonbuilding | −29.6% | +39.3% | |
| Single familyResidential building | −1.0% | −7.3% | |
| MultifamilyResidential building | −14.8% | +7.8% |
Percent change in the dollar value of starts by sector. Bars run from −100% to +100%; the manufacturing bar is cut at the scale's edge. Blank 12-month cells are sectors Dodge did not list in that table. Source: Dodge Construction Network, October release.
Residential dollars fell on multifamily, which dropped 14.8%, while single family slipped 1.0%. (Census reported a rise in October housing starts, which our post on that release covers. Census counts units and Dodge counts dollars, so a month of cheaper units or fewer large towers can push them apart.)
Regionally, the South Central rose 68.2%, the Midwest 51.1% and the South Atlantic 22.0%. The Northeast fell 12.0% and the West 24.6%.
| Region | Oct. vs. Sept. | −100%0+100% |
|---|---|---|
| South Central | +68.2% | |
| Midwest | +51.1% | |
| South Atlantic | +22.0% | |
| Northeast | −12.0% | |
| West | −24.6% |
Percent change in total starts by region, October 2026 from September. Source: Dodge Construction Network.
How to use this number
Over 12 months, nonresidential building is up 25.8% and residential is down 1.7%
A start is a project breaking ground, so its value turns into put-in-place work over the months and years that follow. Two ways to use October's release:
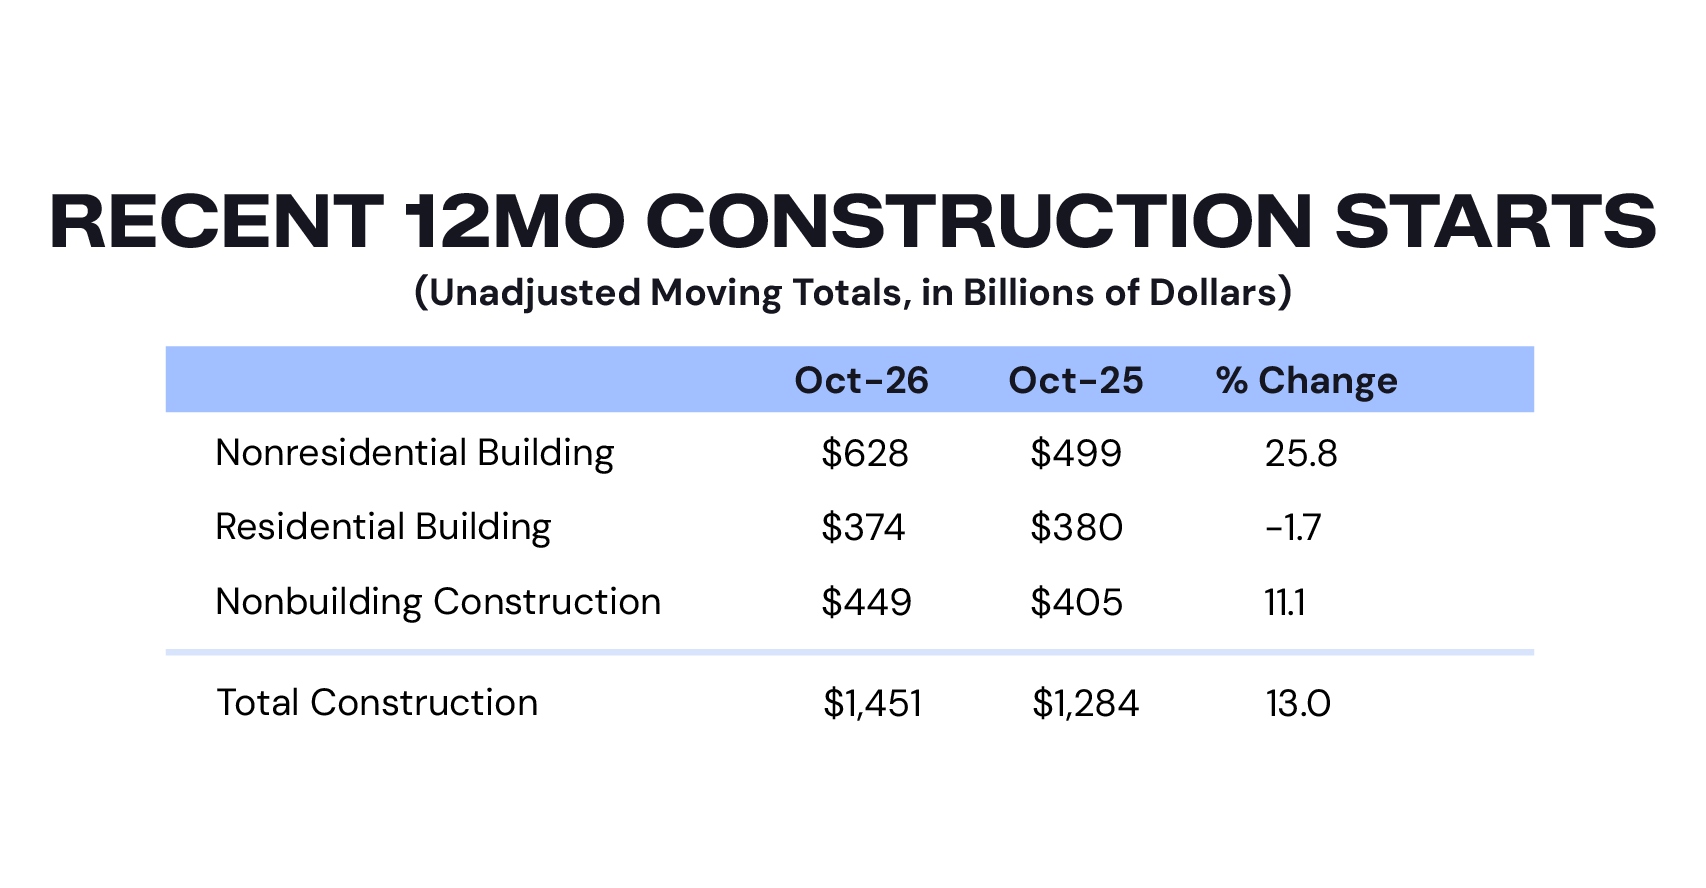
- Use the 12-month totals, which Dodge does not seasonally adjust, as your comparison for annual planning. Nonresidential building was up 25.8% over the latest 12 months and nonbuilding was up 11.1%, while residential was down 1.7%. Set those beside the year-over-year change in your own awarded contract value by the same split. A firm that does not build fabs or data centers should weigh the ex-manufacturing figure heavily, since one chip plant carries much of October's headline.
- Check the sector row that matches your backlog. A specialty contractor in education, offices or multifamily saw declines in October. A heavy civil firm saw highway, bridge and public works starts rise.
12-month moving totals of construction starts, billions of dollars, not seasonally adjusted, 12 months ending October 2025 (open dot) and October 2026 (filled dot). Source: Dodge, Recent 12 Month Construction Starts table, October 2026.
So the planning count and the starts count went opposite ways in October. The Dodge Momentum Index, which tracks nonresidential building projects entering planning, fell 9.0% to 260.4 in October, according to Dodge's November 6 release. Dodge says that index leads nonresidential building spending by a full year to 18 months, so it describes work that would break ground well after the projects counted in October's starts.
Revisions and caveats
October is preliminary, and September was revised up in every segment
October's numbers are preliminary, and Dodge revises the prior month in each release. September moved up slightly:
- Nonresidential building went from $583 billion as first reported to $586 billion.
- Residential went from $366 billion to $367 billion, and nonbuilding from $377 billion to $378 billion.
- The total was stated as $1.33 trillion in both releases, and the October table shows it as $1,330 billion.
| Segment | First reported | Revised | Revision |
|---|---|---|---|
| Nonresidential building | $583B | $586B | +$3B |
| Residential building | $366B | $367B | +$1B |
| Nonbuilding | $377B | $378B | +$1B |
The series swings because a project's full value lands in the month it starts. Over the 13 months above, Dodge's reported monthly change ran from a 24.8% drop in August to a 34.1% gain in May. Dodge's own release headlines tied July's 25.6% gain to 25 projects of $1 billion or more, and described August's drop as starts normalizing after July's megaproject surge. The Dodge Index, which expresses total starts with 2000 set to 100, was 345 in October against 281 in September.
The chart and the table use first-reported values for October 2025 through August 2026 and revised values only for September. October 2025's first-reported segments sum to $1,529 billion, and October 2026's $1,633 billion is 6.8% above that. That comparison mixes two vintages of Dodge's data, which is why the 13.0% gain in the 12-month totals is the better measure of the year.
Dodge's starts record the value of projects when they break ground. Census construction spending records the value of work put in place each month, so the two series can move apart for long stretches. The September construction spending post covers that series.
| Month | Total | 0$1,800B | Change | Nonres. | Resid. | Nonbldg. |
|---|---|---|---|---|---|---|
| Oct 2025 | 1,529 | +21.1% | 561 | 323 | 645 | |
| Nov 2025 | 1,215 | −20.5% | 485 | 368 | 362 | |
| Dec 2025 | 1,242 | +2.6% | 450 | 370 | 422 | |
| Jan 2026 | 1,245 | +0.7% | 378 | 345 | 522 | |
| Feb 2026 | 1,081 | −13.2% | 442 | 374 | 265 | |
| Mar 2026 | 1,220 | +12.8% | 466 | 385 | 369 | |
| Apr 2026 | 1,327 | +9.0% | 550 | 383 | 394 | |
| May 2026 | 1,778 | +34.1% | 647 | 373 | 758 | |
| Jun 2026 | 1,420 | −19.9% | 584 | 363 | 473 | |
| Jul 2026 | 1,788 | +25.6% | 917 | 386 | 485 | |
| Aug 2026 | 1,343 | −24.8% | 624 | 364 | 355 | |
| Sep 2026 | 1,330 | −1.5% | 586 | 367 | 378 | |
| Oct 2026 | 1,633 | +22.8% | 865 | 341 | 427 |
Billions of dollars, SAAR. Change is the monthly change Dodge printed in each release. Rows through August 2026 are first-reported values; September 2026 is revised; October 2026 is preliminary. Source: Dodge Construction Network. Download the data (CSV).